
Tap water
How to Read the Toronto Water Quality Report
The Toronto water quality report is the City's yearly Drinking Water Analysis Summary: a 12-page table of every parameter tested, with limits, sample counts and the maximum, minimum and average for the year.

On this page
Key takeaways
- The current edition is the Drinking Water Analysis Summary 2025, covering January 1 to December 31, 2025, posted by the City in June 2026.
- Each row gives a limit, the number of samples, a reporting limit, the number of detectable results and the year's maximum, minimum and average.
- Results below the reporting limit are recorded as zero, so a "0" means "not detected at that level", not "proven absent".
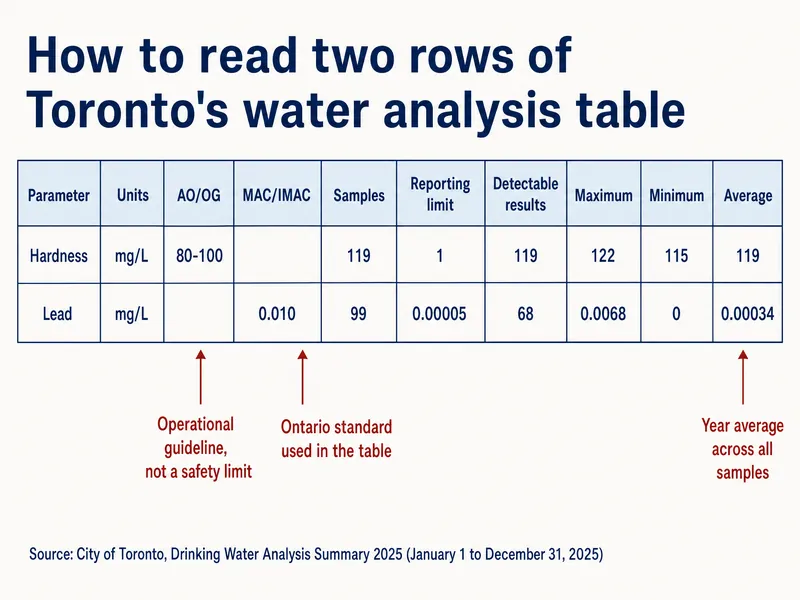
- The "80-100" beside hardness is an operational guideline; the "0.010" beside lead is Ontario's standard under O. Reg. 169/03.
- Lead averaged 0.00034 mg/L across 99 samples, with a maximum of 0.0068 mg/L: under Ontario's 0.010 mg/L standard and above Health Canada's 0.005 mg/L MAC.
- Total trihalomethanes averaged 8.4 µg/L against a 100 µg/L limit in the table.
What the 2025 table reports
- 12 pagesLength of the City's 2025 Drinking Water Analysis SummaryCity of Toronto
- 11,792E. coli presence/absence samples in 2025 (99.99% absent)City of Toronto, 2025 analysis summary
- 0.0068 mg/LHighest lead result in the 2025 summary (average 0.00034 mg/L)City of Toronto, 2025 analysis summary
- 0.005 mg/LLead MAC set by Health Canada in 2019Health Canada
What is the Toronto water quality report?
The Toronto water quality report most people mean is the City's annual Drinking Water Analysis Summary, a table of results "for all Plants and Distribution" over one calendar year. The 2025 edition runs 12 pages and lists microbiological tests, operational parameters, general chemistry, metals, organic compounds and PFAS.
The City also files a longer Drinking Water System Annual Report with the province each year. The 2025 annual report, posted in February 2026, describes the system itself: 4 treatment plants, 18 pumping stations, 11 major underground reservoirs and 4 elevated storage tanks. For a homeowner, the analysis summary is the one with the numbers you can compare against your own concerns; the system report is about operations and compliance.
Where can you find the latest report?
Both are PDFs on toronto.ca, and the City's Tap Water in Toronto page links its drinking water quality and system reports. The analysis summary is posted once the year's results are compiled: the 2025 summary appeared in June 2026, and the system report in February 2026.
If you live outside Toronto, your supplier publishes its own report. The Region of Peel, York Region and Durham Region each post theirs, and the GTA water hardness by city page links each one.
How do you read the analysis table?
Read each row left to right: what was measured, the limit it is judged against, how many samples were taken and what they showed. The 2025 table has these columns, in this order:
| Column | What it tells you |
|---|---|
| Parameters, Units | The substance and its unit (mg/L, µg/L, NTU, pH units) |
| AO/OG | Aesthetic objective or operational guideline: a taste, appearance or treatment target |
| MAC/IMAC | Maximum acceptable concentration or interim maximum: the health-based limit used in the table |
| Sampling date | The period covered; 1/01 to 12/31 means the whole year |
| Number of samples | How many results feed the row |
| Reporting limit | The lowest level the lab reports |
| Number of detectable results | How many samples were at or above the reporting limit |
| Maximum, Minimum, Average | The year's highest, lowest and mean result |
Two notes printed under the table change how you read it. First, "all results below Reporting limit are recorded as zero in this summary". Second, chlorine residual values come from the distribution system, which the City describes as "a chloraminated system". Units also switch between rows: metals are in mg/L, while trihalomethanes, haloacetic acids and PFAS are in µg/L, which is one thousand times smaller.
Which results matter most for homeowners?
For most households six rows answer the common questions: hardness, chlorine residual, fluoride, lead, sodium and disinfection by-products. Here they are from the 2025 table:
| Parameter | Limit in the table | Samples | Max | Min | Average |
|---|---|---|---|---|---|
| Hardness (mg/L as CaCO3) | 80–100 (OG) | 119 | 122 | 115 | 119 |
| Total chlorine residual (chloramines), mg/L | 3.0 | 6,635 | 2.5 | 0.28 | 1.6 |
| Fluoride, mg/L | 1.5 | 1,609 | 0.83 | 0.15 | 0.65 |
| Lead, mg/L | 0.010 | 99 | 0.0068 | 0 | 0.00034 |
| Sodium, mg/L | 200 | 157 | 29.9 | 13.1 | 14.8 |
| THM (total), µg/L | 100 | 73 | 26.8 | 5.2 | 8.4 |
Hardness explains scale on kettles and is covered on the Toronto water hardness page. The chlorine residual explains the smell, and fluoride is added on purpose; both are covered in the Toronto tap water guide. Trihalomethanes are disinfection by-products; the 2025 average of 8.4 µg/L sits well under the 100 µg/L figure in the table, which matches Ontario's standard in O. Reg. 169/03. Haloacetic acids (HAA5) averaged 3.0 µg/L against 80.
Sodium matters mainly to people on a sodium-restricted diet. The 2025 average was 14.8 mg/L. A water softener using sodium adds more; Health Canada advises that some water, such as the kitchen tap, bypass the softener, as discussed in the softener decision guide.
What do MAC and operational guideline mean?
A maximum acceptable concentration (MAC) is a health-based limit; an operational guideline is a target that helps treatment and pipes work well. Health Canada sets MACs in its Guidelines for Canadian Drinking Water Quality, and Ontario turns many of them into legal standards in O. Reg. 169/03, Schedule 2. The figure printed in Toronto's table is not always Health Canada's current number, so check which body it belongs to.
Three rows show why. For lead, the table prints 0.010 mg/L, which is Ontario's standard; Health Canada's MAC, set in March 2019, is lower at 0.005 mg/L. For chloramines, the table prints 3.0 mg/L, but Health Canada's 2020 chloramine guideline concludes a MAC is not needed at all. For hardness, "80-100" is an operational guideline: Health Canada describes that range as a balance between corrosion and scale and sets no health-based value for hardness.
An aesthetic objective (AO) covers taste, smell or appearance, while an operational guideline covers how well treatment and distribution are working. A result above an AO or OG is a quality or operations matter, not the same signal as a result above a MAC.
How does the report handle lead?
The analysis summary lists 99 lead samples for 2025, 68 of them above the 0.00005 mg/L reporting limit, with an average of 0.00034 mg/L and a maximum of 0.0068 mg/L. That maximum is under Ontario's 0.010 mg/L standard printed in the table, and above Health Canada's 0.005 mg/L MAC. It is not accurate to say every sample met Health Canada's guideline.
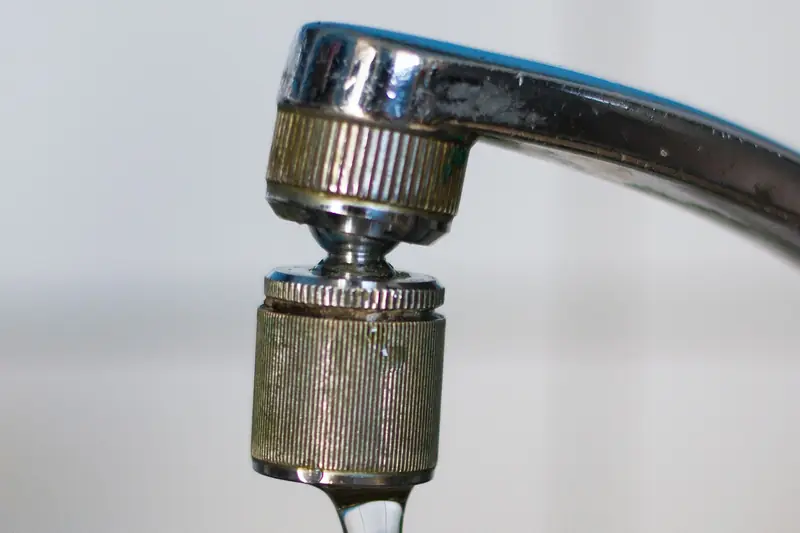
These samples describe City water at the plants and in the distribution system, not water that has passed through a lead service pipe in an old house. Water from the plants contains no lead, according to the City's Annual Lead Mitigation Report 2025; lead enters from service pipes, older solder and leaded-brass fixtures. That separate report covers the province's regulated sampling at homes and businesses: in 2025 none of the 29 sites tested exceeded 10 parts per billion (0.010 mg/L), and one residential sample exceeded 5 ppb. In 2008, before phosphate corrosion control began, 52% of samples from 100 sites exceeded 10 ppb.
The report also notes that Ontario's environment ministry is considering adopting the lower 5 ppb limit. If your home was built before the mid-1950s, the citywide table cannot tell you what is in your own tap; a free City test can, as explained on the lead pipes in Toronto page.
How we put this page together
Built from the City's 2025 analysis summary (downloaded and read in full, October 2026), its 2025 system report to the province, its lead mitigation report for 2025, its tap water page (as revised July 22, 2026), Health Canada guidelines for lead and chloramines, and Ontario's O. Reg. 169/03. Every figure in the tables above is copied from the City's PDF. Left out: interpretation of individual organic-compound rows, comparisons with other cities' reports beyond hardness, and health advice beyond Health Canada and Toronto Public Health.
Common questions
Is there a Toronto water quality report for my street?
No. The City publishes one system-wide summary, not results by street or neighbourhood. To learn about the water at your own tap, especially for lead, register for the City's free lead test through 311.
Why do some rows in the Toronto report show 0?
The summary records any result below the lab's reporting limit as zero. A zero means nothing was found at or above that level, not that the substance is proven absent. The reporting limit column tells you how sensitive the test was.
Does the Toronto water report test for PFAS?
Yes. The 2025 summary has a section for per- and polyfluoroalkyl substances, including PFOS and PFOA, each with a reporting limit of 0.002 µg/L. In 2025 both PFOS and PFOA were recorded as zero, meaning below that limit.
What does IMAC mean in the City's table?
IMAC stands for interim maximum acceptable concentration. It is a provisional health-based value rather than a final one. The column header combines MAC and IMAC, so read the number with the body that set it in mind.
Why does the report list E. coli as a percentage?
E. coli is tested as present or absent, so there is no average concentration to report. In 2025, 99.99% of 11,792 samples were absent. The notes say these samples include water collected after watermain repairs and in response to water quality inquiries.
How often does the City update the analysis summary?
Once a year, covering January 1 to December 31. The 2025 summary was posted in June 2026. Check the City's tap water page for the newest edition.
Can a home water test be compared with the City's table?
Yes, if units match. Convert µg/L to mg/L by dividing by 1,000, and remember the City's figures are averages across the system while your result is a single sample from your tap.
Related guides

More help: see our Toronto home water guide.